Productivity in Small Businesses - A Note
Hello,
In the last few months, I have been reading about small businesses and different aspects of it - operations, productivity, strategy, control, expansion & growth, technology, intellectual property and so on. There are quite a bit of difference between small and large businesses in every aspect mentioned. All of my focus was on control, strategy, expansion & growth - mostly reading and thinking about what kind of strategies are needed to expand small businesses, say for a small firm that wants to go international or wants to open shop in a different region of the country, and management control - how effectively a particular strategy can be executed through the organization - these are very interesting aspects of any business, not just small business. But recently, my focus briefly shifted to another aspect that is essentially linked to strategic management and has serious consequences on the larger economy. I came across an instagram reel [1] by Keshav Bedi / Pure Economics [2] that briefly compared the productivity between small and large firms. Despite all the romanticism and applause that small firms get for being the backbone of a nation’s economy, for employing large part of the workforce, for contributing to a significant amount of exports and the GDP and so on (these are lines you would find in almost every post/paper on small firms, even the most serious ones because they are true to a large extent), there seems to be a fundamental problem with small businesses - that is its low productivity. Small firms have very low productivity in comparison with large firms. According to the IMF report [3] referenced in the reel, it is found that the productivity of small firms in India is less than 20% that of large firms. Below is the excerpt.
- India has numerous small establishments with substantial paid employment but relatively low productivity (Figure 3).4 Nearly three quarters of manufacturing establishments in India employ fewer than five paid workers, compared to 38 percent of manufacturing establishments in the United States. By contrast, less than 2 percent of India’s establishments have more than 100 paid workers, whereas 9 percent of American establishments do. Mirroring differences in the size of establishments, India also has a much larger share of employment in small companies than the U.S. Small companies tend to be less productive than large ones, and the relative difference in productivity between large and small firms is much larger in India than in the U.S.: the smallest firms in India are less than 20 percent as productive as large companies, while in the U.S., this ratio is about 45 percent. This puts India at a compounded disadvantage by not only having more small firms employing a larger share of workers, but also by having a much larger productivity drag in these small firms. Small establishments in India do not seem to have a disproportionately young age distribution. This suggests that their size is not due to many new establishments, but rather to challenges in growing and increasing productivity.
The below lines from the excerpt summarize the phenomenon.
This puts India at a compounded disadvantage by not only having more small firms employing a larger share of workers, but also by having a much larger productivity drag in these small firms. Small establishments in India do not seem to have a disproportionately young age distribution.
It is noted that this phenomenon is not unique to India but in every economy. It is the case in small businesses in USA as well as other nations but are found in different degrees. Keshav also shares an excerpt from a review [4] of an interesting book on Italian Economy [5] that jots down a similar problem.
I think this aspect can again be seen from two perspectives: First is a management perspective - the kind of management principles of small firms that possibly lead to low productivity compared to large firms, are there any structural/fundamental problems in small businesses and obviously how it can be improved through better management practices. The second is to look at it from economics perspective - measure productivity for firms (micro) and then check how it affects the macro-picture, and see if and how policy changes can help improve productivity of small firms at scale. Generally, I am inclined to look at the management perspective first, but in this case, I want to look at the economics view and numbers first. I think if the hypothesis of “Productivity is low in small firms” is proved to a reasonable extent using numbers, then it makes a compelling case to improve it in any way possible (better management practices, possible new management research, policy changes and so on). So this article deals with the economics and numbers related to productivity of small firms.
The following is the plan: We’ll see what productivity is in brief, how it is defined, how it looks at the national/regional level, get an idea of what productivity is in firms, how it relates to firm-size and resource allocation through an example, then review a variety of secondary data sources like academic publications, economics reports, industry white papers and such to understand the relation between productivity and firm-size in different contexts (nations, regions, industries etc.,).
Let us get started.
1. What is Productivity?
The simplest definition of productivity is the ratio of Output over Input (P = Output / Input). But the definition is of use if we measure productivity of a certain entity - be it labor, capital employed, raw materials used, or of the firm, of a region or a nation itself. How it is measured is defined in depth here [10]. There are broadly two types of productivity measures - Singlefactor Productivity (SFP) and Multifactor Productivity (MFP) [8]. Labor Productivity [6] is a very common measure of productivity - it is defined as the ratio of total output per hour worked. Material Productivity [7] is defined as the amount of economic output per unit of materials consumed. In a typical production process, both labor and capital (financial and material) are employed. Productivity using both these inputs are defined as Multifactor Productivity (MFP) [8]. Another important measure of productivity is Total Factor Productivity (TFP)[11]. The concept of TFP is described well in [11].
It’s a measure of an economy’s ability to generate income from inputs—to do more with less. The inputs in question are the economy’s factors of production, primarily the labor supplied by its people (“labor” for short) and its land, machinery, and infrastructure (“capital”). If an economy increases its total income without using more inputs, or if the economy maintains its income level while using fewer inputs, it is said to enjoy higher TFP.
This is an intuitive description of TFP, there are multiple quantitative methods to calculate it each with its own advantages/drawbacks and suitability [13].
2. Productivity of Firms
Productivity and its growth (improvement in productivity with time) has been an important driver of economic growth/prosperity of nations [14]. Economics literature is filled with publications on why that is - on how productivity growth is a core driver of standard of living, workers’ wages/compensations, has important implications on employment rates, inflation and such macro-economic indicators. Earlier, the productivity studies were restricted to nation/region level due to the unavailability of data but with the availability of richer and more granular data since the late 1980s, there are a large number of studies at the sectoral/industry level [15], firm level [16] and a variety of other studies using such finer data [17, 18].
From what I understand, there are some advantages of high productivity that are directly visible - like the reduction of cost of production which can improve real earnings, can possibly lead to reduction of goods’ prices behefiting the customers, possibly increase wages/compensation if management decides to share the increased earnings with the workers, increase in shareholder wealth and so on. But what is interesting is productivity seems to have major consequences on firms that one can immediately think of. Consider the phenomenon of “Firm Exit”, simply a firm closing shop [20]. An interesting paper from 2022 [19] studies if the economic crisis caused by COVID-19 causes less productive firms to exit. Below are the findings (picked directly from its abstract).
Using firm-level data collected for 34 economies up to 18 months into the crisis, the study finds that less productive firms have a higher probability of permanently closing during the crisis, suggesting that the process of cleansing out unproductive activities is occurring. The paper also uncovers strong and negative relationships of firm exit with digital presence and with innovation. These relationships are driven by small firms. The study further finds that a burdensome business environment increases the probability of firm exit, also driven by small firms, and that a negative relationship exists between firm exit and age. Finally, evidence shows that the cleansing process is disrupted in countries which have introduced policies imposing a moratorium on insolvency procedures.
As the paper states in its summary, the purpose was to check if firms that are more productive are less likely to exit during the economic crisis caused by the pandemic. The hypothesis was proved in the sense that it was found out that more productive firms are more likely to survive the crisis (this, among many other interesting findings including a couple related to small firms).
The phenomenon of internationalization as the choice of business expansion in small firms has intrigued me. I generally read about it from a management perspective. Internationalization is the expansion of business of a firm into foreign nations, with the existing products,adaptations of existing products or entirely new products (this is simply the Product-Market / Ansoff Matrix). Then one delves into seeing what makes these markets attractive, an in-depth analysis into the GTM (Go-To-Market strategy), practical stuff like setting up the supply chain and so on. But what is interesting is economics attempts to explain how/why certain firms internationalize and some don’t. This paper by Bernard et al. [21] compares exporter and non-exporter firms. It has some really interesting findings. Below is an excerpt from the paper’s introduction.
The fact that exporters have a productivity advantage before they start exporting suggests self-selection: exporters are more productive, not as a result of export- ing, but because only the most productive firms are able to overcome the costs of entering export markets. This sort of microeconomic heterogeneity can influence macroeconomic outcomes. When trade policy barriers fall or transportation costs decline, high-productivity exporting firms survive and grow, while lower-productivity nonexporting firms are more likely to fail. This reallocation of economic activity across firms raises aggregate productivity and provides a nontraditional source of welfare gains from trade.
The paper describes the concept of self-selection of firms which internationalize/export their products, and the most productive firms are seem to be exporters. The paper itself presents empirical evidence supporting this hypothesis, and there is good amount of evidence for the same that have been documented over the years (the paper was published in 2007). There is also a theoretical/mathematical model (known as the Melitz model [22]) that analyzes the effects international trade has on an industry (industry and firms inside it). Here is a short excerpt from the paper.
The model shows how the exposure to trade induces only the most productive firms to export while simultaneously forcing the least productive firms to exit. Both the exit of the least productive firms and the additional export sales gained by the more productive firms reallocate market shares towards the more productive fims and contribute to an aggregate productivity increase. Profits are also reallocated towards more productive firms.
This is an interesting model, and has good amount of empirical evidence to suppor this behavior in the industry.
We looked at two ideas that can be quite useful from a management perspective. In the management world, Productivity, Efficiency etc., are mainly thought to reduce costs, improve bottom-line, possibly improve processes, better customer experience and satisfaction and so on. But itseems that there are proven consequences of productivity far beyond these items, that actually matter to the firm’s existence / lifecycle, matters that are strategic in nature. If a firm owner is planning expansion through exports, the above findings can help the owner - are there pre-requisites / necessary conditions to becoming an exporter? Are there productivity threshold for firms, or can they be defined to classify them into risky/stable/ambitious firms? Then the classical management research questions of how productivity can be improved? and so on.
Now coming to this article’s topic of discussion, we will primarily be discussing productivity of small firms, in comparison with large firms. Re-sharing the excerpt from a 2025 IMF report referenced earlier [3] in the form of bullet points.
- Nearly 75% of manufacturing establishments in India employ fewer than five paid workers, compared to 38% of manufacturing establishments in the USA.
- By contrast, less than 2% of India’s establishments have more than 100 paid workers, whereas 9% of USA establishments do.
- India also has a much larger share of employment in small companies than the US Small companies.
- Small companies tend to be less productive than large ones, and the relative difference in productivity between large and small firms is much larger in India than in the US - the smallest firms in India are less than 20% as productive as large companies, while in the US, this ratio is about 45%.
- India is at a compounded disadvantage by not only having more small firms employing a larger share of workers, but also by having a much larger productivity drag in these small firms.
- The size of small firms is not due to many new establishments, but rather to challenges in growing and increasing productivity.
These are interesting observations, and I want to dig a little deeper into this. To do so, I plan to conduct informal reviews of secondary data sources on productivity at national level, industry/sectoral level and firm level, all this in the context of the USA.
3. Productivity in the USA
So far, we have looked at Productivity in a conceptual manner. In this section, we’ll take a quick look at what it actually look like. Consider this recent news release from US Bureau of Labor Statistics [23]. This news release shares details related to labor productivity for the first quarter of 2026 (Jan 1 to March 31). First of all, productivity is an absolute number (Aggregate Output over Total Hours worked), it is seen as an index as well (ratio of productivity of this year over productivity of a base year), or the productivity growth is considered (year on year, quarter on quarter) to see in which direction productivity is moving. Let us start with the with the nonfarm business sector labor productivity.
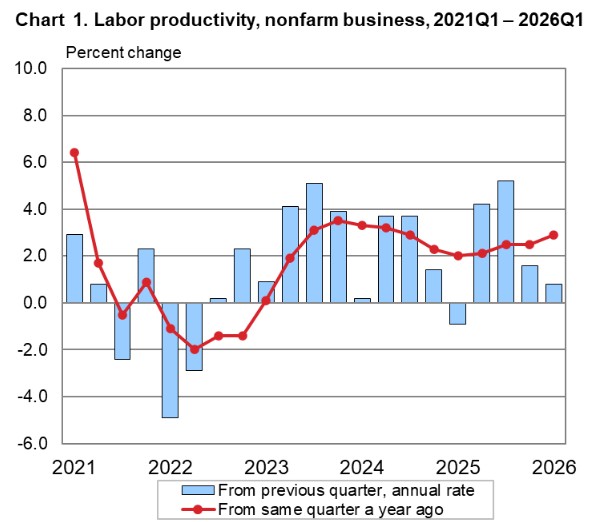
Nonfarm business sector labor productivity increased 0.8 percent in the first quarter of 2026, the U.S. Bureau of Labor Statistics reported today, as output increased 1.5 percent and hours worked increased 0.7 percent. (All quarterly percent changes in this release are seasonally adjusted annualized rates.) From the same quarter a year ago, nonfarm business sector labor productivity increased 2.9 percent in the first quarter of 2026.
The nonfarm business sector labor productivity has increased by 0.8% in the 2026 Q1 (relative to 2025 Q4). In comparison with 2025 Q1 (same quarter an year ago), it has increased by 2.9%. The below chart should gives the same info starting 2021 Q1.
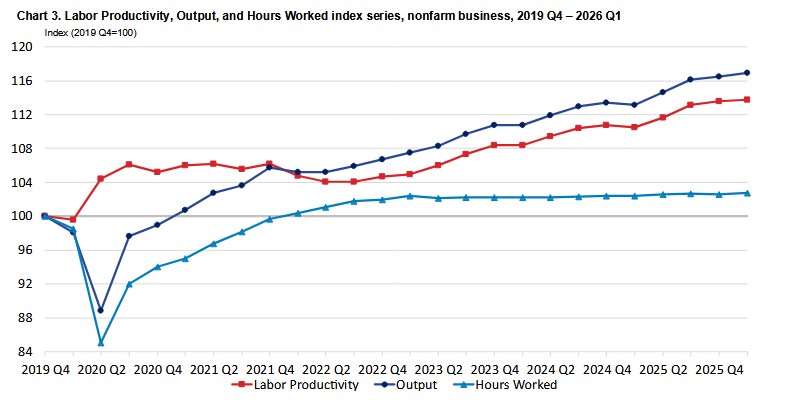
Along with that, a Productivity Index is also constructed, with base productivity numbers belonging to 2019 Q4 (keeping it to 100). Below is the chart that gives the indices for labor productivity, aggregate output and total hours worked.
Similarly, the news release shares information about Manufacturing sector labor productivity - which increased by 3.6% in 2026 Q1 (relative to 2025 Q4) and by 1.7% from the same quarter an year ago (2025 Q1). The US Bureau of Labor Statistics further breaks down Manufacturing into Durable and Non-Durable Manufacturing sector, of which numbers are calculated. Coming to absolute productivity numbers of 2026 Q1. One can find the absolute numbers like Total Value-Added Output, Total Hours Worked here [24] but the absolute productivity will have to be computed manually.
Coming to Total Factor Productivity, it is the Productivity measured by considering all types of inputs (not just single output like labor or capital). Consider the news release from March 2025 [25] which discusses TFP for FY 2024-25 in detail. TFP is defined in the following manner.
total factor productivity is designed to measure the joint influences of technological change, efficiency improvements, returns to scale, reallocation of resources, and other factors on economic growth, allowing for the effects of capital and labor.
Both Labor input and Capital input are combined using a mathematical method to be used in TFP calculation. As per the release, the TFP increased 0.8% in FY 2025 (relative to FY 2024), with output increasing by 2.6% and a 1.7% increase in the combined inputs of capital and labor. Individualy speaking, capital input increased by 2.7% in FY 2025 and labor input increased by 1.1%. Labor input is not just the total number of hours worked but is a combined effect of total hours worked and labor composition (which is an estimation of shifts in age, education, sex of the workforce). I suggest you to read about labor composition directly from the news release. Along with the US BLS website and all the resources available, this article [26] discusses in detail how productivity metrics published by US Bureau of Labor Statistics are actually costructed.
This is how actual productivity numbers (primarily Labor and Total Factor Productivity) look like, at the nation level. the US BLS publishes a wide variety of numbers on the basis of state, industry/sector, regions and so on.
Now let us head to our main discussion on productivity and firm-size.
4. Productivity, Firm-Size and Resource Allocation: Ireland’s example
Firm-level data is not something that was always available. Metrics were generally measured at the industry/regional/state/nation level. Emergence of firm-level micro-data databases like the Longitudinal Business Database (LBD) [27], Business Register [28] both by the US Census Bureau [29], commercial datasets like the OECD ORBIS [30] that has firm level micro-data of over 44 million firms from 30+ countries, along with that nations and governments tend to maintain their own databases (Eg: India’s can be found here [31]). In addition to that, many financial institutions, ones which are into policy making and such also have created firm-level databases and provide them on request.
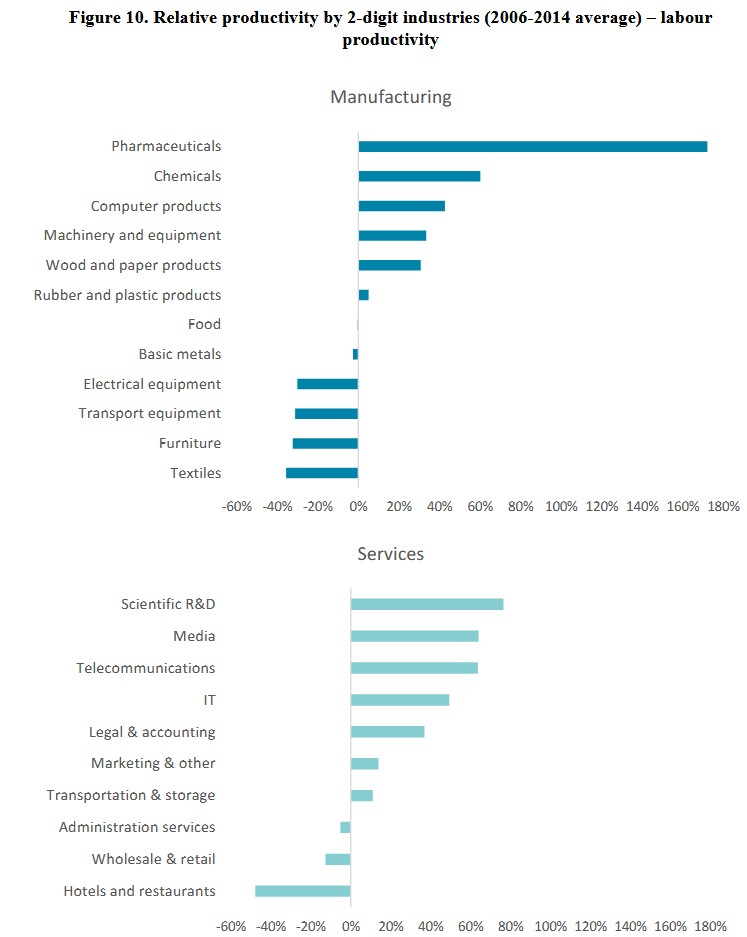
To get a sense of what firm-level productivity actually is, how it looks like, why its beneficial to consider it and the kind of insights it can share, let us take the example of firm-level productivity analysis in Ireland [32]. There is quite a bit of empirical evidence to show significant variations and differences in productivity among different industries and among firms within the same industries. Below is a good example for the same.
For example, in the US manufacturing sector, productivity in the 90th percentile firm was on average 1.92 times higher than the 10th percentile firm, implying that given the same inputs, the 90th percentile firm makes nearly twice as much output as that of the 10th percentile firm (Syverson, 2004).
When there are such intra-industry variations, just looking at nation-level data and statistics does not give the full picture. Questions like what industries are lagging behind, what type of firms inside a particular industry are suffering from low productivity, what could be the possible reasons - is it lack of innovation, is it related to labor composition, what are the differences between the high and low productivity firms and what lessons can be learnt, are there any structural differences in the low productivity firms that are hard to resolve, how can management research help in tackling specific productivity problems, what kind of policy is needed and so on. Below chart gives a gist of relative productivity (labor productivity) among different industries (both manufacturing and services).
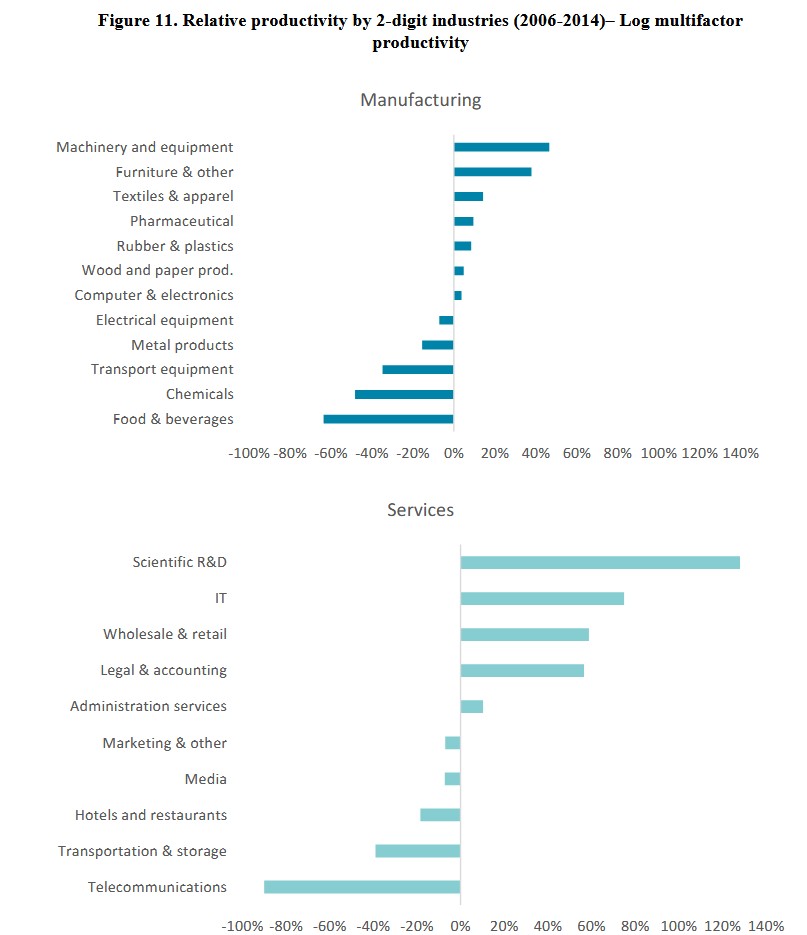
But below chart gives info about the Multi Factor Productivity among industries.
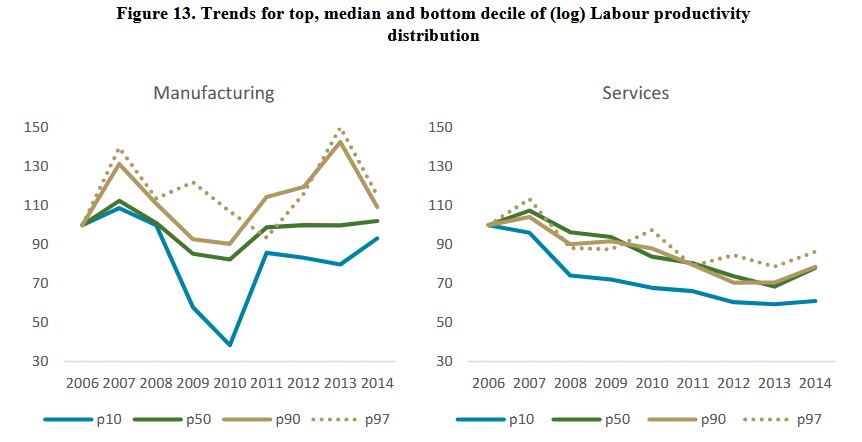
Going one step further, we look at the productivity distribution among firms in the manufacturing and services sectors. The authors call them frontier, median and laggard firms.
The paper is full of interesting results, but one set of results which are of our interest is the relationship between firm size and productiviy, which is discussed in Section 6 of the paper (under “Efficiency of Resource Allocation”). Because we want to know how firm-size and productivity vary with each other, it will be interesting to track the covariance between the two variables: firm-size (as X variable) and firm-productivity (as Y variable). If the covariance is positive, then it means the productivity increases as firm-size increases. If it is negative, it means productivity tends to decrease with increase in firm-size. But what does firm-size even mean? Every firm has a bunch of resources (labor, capital etc.,) working for it during its lifetime. Common sensically speaking, the size of a firm (firm-size) is simply the amount of resources stuck with it. For example, size of firms is generally decided by the number of employees it has (labor), or investment in plants/machinary (capital) (and other factors like annual revenue/turnover). For example, in the USA, a small business is one that has less than 500 employees and turnover less than a certain threshold. Below are the factors for classifying a firm as an MSME (Micro/Small or Medium size firm) in EU [33].
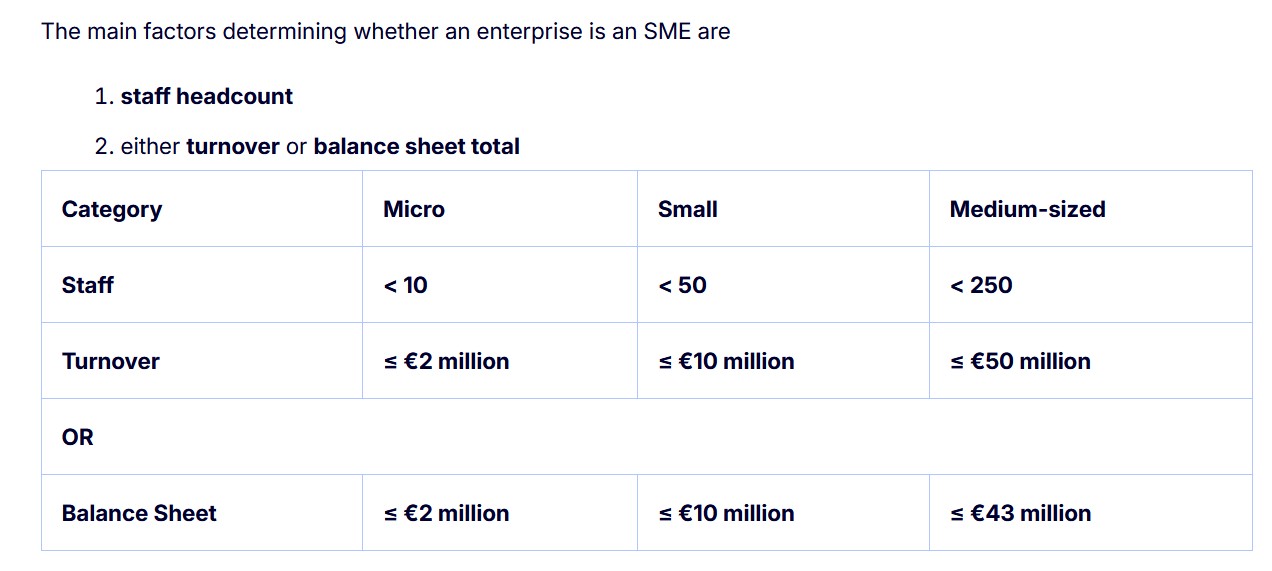
A micro firm is one that has less than 10 employees (labor), turnover of less than 2 million EUR (output) or assets (capital) less than 2 million EUR. Similar definition exists in the Indian context [34]. So firm-size is analogous to the amount of resources a firm has. Coming back, the covariance increases if more productive firms capture large share of resources in the sector. This is ideally what we want, for resources to be allocated to the most productive firms in the sector. Therefore, the covariance is a good measure of resource allocative efficiency - does more productive firms command larger share of resources or not.
Aggregate productivity for an industry is the total industry output over the total resources utilized (consider the basic definition of productivity here). It looks something like this:
agg_prod = (O1 + O2 + O3 + ..... + On) / (R1 + R2 + R3 + .... + Rn)
If the productivity of these individual firms are P1, P2, ...., Pn, then, the above would boil down to,
agg_prod = (R1 * P1 + R2 * P2 + .... + Rn * Pn) / (R1 + R2 + R3 + .... + Rn)
This simply looks like the weighted mean with weights being resources. So the aggregate productivity is also known as the weighted productivity. Consider this example to checkout the significance of weighted productivity. Take two firms F1 (resources = 1, productivity = 10) and F2 (resources = 100, productivity = 1). Basic average productivity would be the following:
avg_prod = (P1 + P2) / 2 = (10 + 1) / 2 = 5.5.
Now consider the aggregate productivity.
agg_prod = (1 * 10 + 100 * 1) / (1 + 100) = 110/100 = 1.09
This is a better and more real productivity measure because it takes resources utilized into account. What does this disparity between average and aggregate productivity indicate? What does it mean to have lower aggregate productivity? To understand this, let us go back to the paper. The paper presents in an interesting idea on how aggregate productivity of an industry/sector can be seen as a combination of average productivity of the firms in the industry and the efficiency with which resources are allocated. To wrap my head around this idea, I tried to take a hypothetical example, to get a sense of what the authors are trying to convey. Consider an industry with a total of 60 firms with the following distribution.
- 10 large firms, each with 100 units of resources, with an average productivity of 1.5.
- 20 medium-sized firms, each with 50 units of resources, with an average productivity of 1.
- 30 small-sized firms, each with 25 units of resources, with an average productivity of 2.
In this industry, the small firms are the most productive, following the large ones and in the last place are the medium-sized firms. Calculating average productivity of the industry is simple.
avg_prod = (10 * 1.5 + 20 * 1 + 30 * 2) / (10 + 20 + 30) = 1.5858
The following is the aggregate productivity:
agg_prod = (10 * 100 * 1.5 + 20 * 50 * 1 + 30 * 25 * 2) / (10 * 100 + 20 * 50 +30 * 25) = 4000 / 2750 = 1.4545
Consider the distribution - firms that are most productive have least amount of resources, firms that are least productive have more resources than the most productive ones, and the moderately productive ones have the largest amount of resources. Ideally, we want firms with highest productivity to command most number of resources, we want least (or ideally zero) resources to be allocated for low productivity firms. So there is something wrong with the current resource distribution/allocation in the hypothetical industry, there is clearly a misallocation of resources - which ought to be fixed. The resource allocation is not the most efficient - and the aggregate productivity being lesser than average productivity is an indication of that. Suppose there is some course correction, all 20 medium-sized firms exit the industry due to unsustainable operations, and are ready to sell off the business - those resources are freed up and ready to be reallocated - each of the 10 large firms end up acquiring 50 units of resources from 10 medium-sized firms and 10 small firms each acquire 50 units of resources from rest of the 10 medium-sized firms. Now the following is the average productivity:
avg_prod_new = (10 * 1.5 + 30 * 2) / (10 * 30) = 75/30 = 2.5
This is because the firms that pulled down the average have exited the industry. The below is the aggregate productivity.
agg_prod_new = (10 * 150 * 1.5 + 20 * 25 * 2 + 10 * 75 * 2) / (10 * 150 + 20 * 25 + 10 * 75) = 4750 / 2750 = 1.7272
The aggregate productivity has gone up relative to previous the previous number because the resources have flown into relatively more productive firms. But comparing the new average productivity and aggregate productivity, the disparity has increased. If you look at it, the resources are still highly misallocated - in order to maintain high productivity, theoretically, the resources should have never flown to the large firms and should have ideally been acquired by the small ones (because small ones are more productive than large ones). If that was the case, the following would be the numbers.
avg_prod_2 = (10 * 1.5 + 30 * 2) / (10 * 30) = 75/30 = 2.5
Below would be the aggregate productivity.
agg_prod_2 = (10 * 100 * 1.5 + 20 * 75 * 2 + 10 * 25 * 2) / (10 * 100 + 20 * 75 + 10 * 25) = 5000/2750 = 1.8181
It improved because the resources got better allocated, but they are still highly misallocated. The gap is arising from the misallocation of resources, or resource allocation inefficiency. So coming back, aggregate productivity now can be seen as a combination of average productivity and resource allocative efficiency (which is contributing in a negative manner in our example). This exercise was undertaken to establish the relationship between productivity, firm-size and resource-allocation. Please note that these are vague examples and average/aggregate productivity computations are not as straight-forward as we saw in the hypothetical examples. The weighted industry level productivity is actually computed in the following manner (from fhe paper):
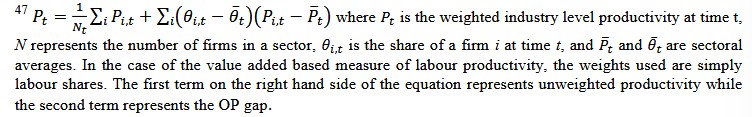
One can identify that the first term is the average productivity. The second term is the gap/disparity between average and weighted productivity. The second term ought to be positive when efficient resource allocation happens and negative during negative allocation. This second term is known as OP gap (Olley-Pakes gap).
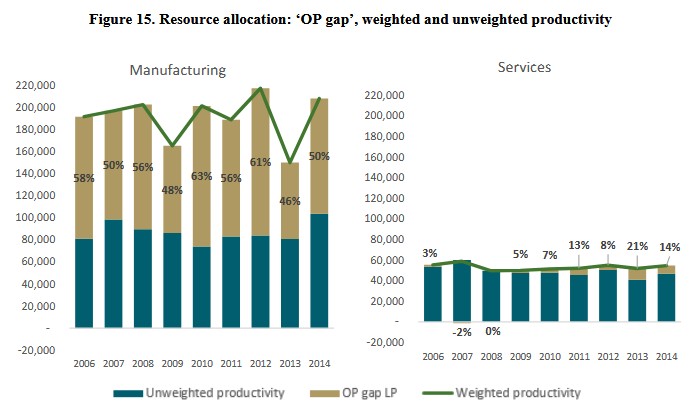
The following is how much resource allocation contributed to the overall productivity each year. Note how important resource allocation efficiency is to overall productivity (it contributes to a significant part of the aggregate productivity).
The paper then talks about an improved version of what we discussed, a dynamic version which considers more factors (and not just firm productivity and resource allocation), it considers industry dynamics like firm entry and exit (Ideally, we want low productivity firms to exit, so that those resources are freed up and can be allocated to high productivity ones, or the firms which make new entry tend to become more productive with time).
Anyway, coming back to results that are of more relevance to us, consider the below. Consider the following graph on productivity growth.
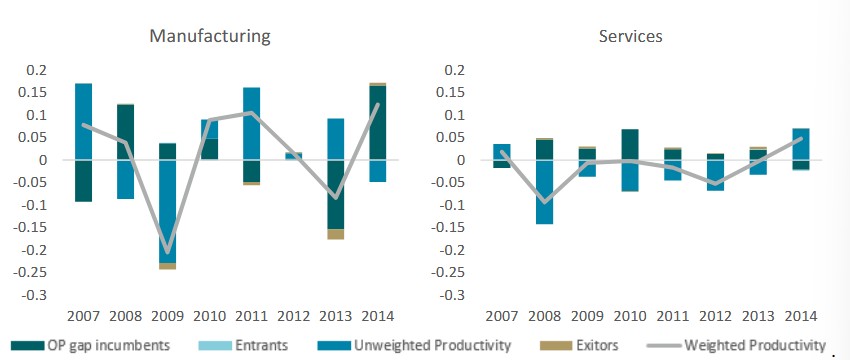
This is a graph on productivity growth (not productivity) over the years and the contributions of different factors. Two factors are of concern to us: The Unweighted Productivity and OP gap incumbents. The Unweighted Productivity is simply the average productivity of firms. The OP gap incumbents is the one the productivity contributor based on resource allocation. Note how the Unweighted Productivity and the OP Gap are negatively correlated - in other words, why do they move in opposite manner (if one is contributing positively to productivity growth, other is contributing negative and vice versa). The authors argue that the answer lies in the underlying structure of the Irish economy.
The negative correlation between the within and reallocation terms is may be related to the structure of the Irish economy, with a large number of small (low-productivity) firms and a very small number of large and highly productive firms. This leads to a situation whereby growth in productivity amongst small and less productive firms will increase the unweighted (within firm) term, but reduce the reallocation term (the OP gap), and vice versa.
This paragraph has many important points to note, but the item of interest is about the structure of Irish economy as observed by the author - The Irish economy is structured in such a way that there are a large number of small firms (which are also of low-productivity) and only a few large firms which are highly productive. We noted a similar observation on the Indian economy as well.
Atleast in the case of Ireland, small firms are of low productivity and high productive firms tend to be large in size.
In summary, this is how the dynamics between firm-size, productivity and resource-allocation work. This was a superficial overview of the same.
Having seen what productivity means for a region, how it is defined, the dynamics between productivity, firm-size and resoure-allocation, we are ready to look at a few interesting secondary data sources that discuss productivity and firm-size strictly in the context of the USA.
5. The Small Businesses’ landscape in USA
A very recent article published in the US Census Bureau [35] gives a comprehensive view into the landscape of small businesses in the USA. To start with, a small business is defined as one which has less than 500 employees.
Businesses with no paid employees (basically the smallest possible businesses) account for over 78% of all US establishments in 2023 and there were close to 30.5 million of such businesses, and they brought in $1.8 Trillion in revenue in 2023 which is 6.4% of US GDP in 2023. Coming to businesses that had employees between 1 and 500, there were about 5.58 milliom of them in 2023.
There are a total of 36.2 million small businesses in the USA, which account to 99.9% of all US small businesses [37]. It employs about 62.3 million people which amount to a massive 45.9% of all US employees. The economic activity from small businesses is close to 43.5% of US GDP. Small businesses pay 38.7% percent of total private sector payroll - all this is as of 2026.
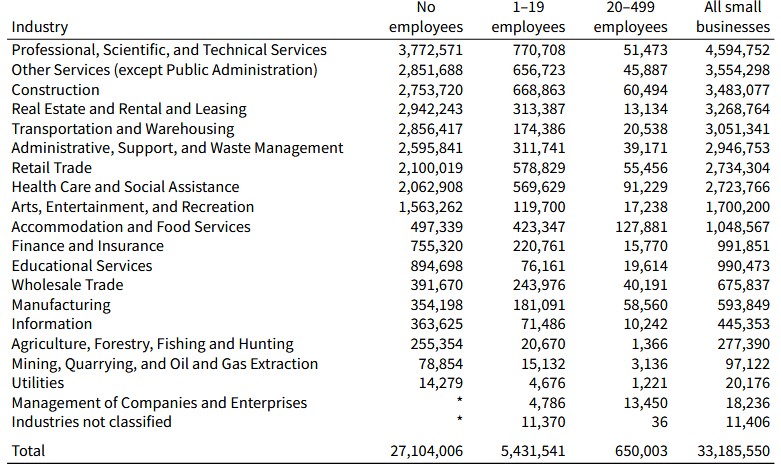
Now coming to industry-wise small businesses, below is the small business profile by size and industry (as of 2019 US Census data [36]).
That is a brief profile of small businesses in the USA.
6. Small firms and Productivity in USA
Firm-size and the effects it had on many activities of a business were already subjects of academic research by the late 1960s, early 1970s. In the USA, the Center of Economic Studies (CES) setup the Longitudinal Research Database (LRD) at the US Census Bureau [41], and most of the databases and datasets were gathered post that. So I believe studies in economics at the firm-level granularity probably increased at that time. There are bunch of interesting papers from the 1970s - on firm size and inventive activity [38] using firm data from Sweden, firm size and research activity in France and USA [39], firm size and efficient entrepreneurial activity [40], profitability patterns and firm size [42], optimum firm size and loss of control in firms [44] to list a few. Not only research related to firm size grew but it was now used as one of the factors/variables in a variety of studies.
To take up this review, I primarily put together academic publications between the 1950 and 2025 from google scholar based on a two simple keyword match:
- “productivity” “small business” (“United States” OR “US” OR “USA”)
- “productivity” “firm size” (“United States” OR “US” OR “USA”)
10 pages of google scholar results were checked for every 5 year intervals starting 1970 (1970-1975, 1976-1980, …., 2021-2025, 2026). Only the most relevant publications were chosen to be part of this review.
One of the earliest papers found on firm size and productivity is “Labor Productivity in Large and Small Enterprises, 1980” [43], which looks at labor productivity in variety of firms inside similar industries. The main observation of the paper is that small businesses are generally less productive than large ones. The study looks at six industries in total (Mining, Construction, Manufacturing, Wholesale, Retail Trade and Services) with each industry containing firms of different sizes. The insights to be drawn from the paper are more based on the industry - productivity is better in large firms primarily in manufacturing, construction and mining industries. The different is less in other sectors, although large firms mostly did have higher productivity numbers. Another interesting observation made is that industries with large number of small firms are sectors with below average productivity (because the low productivity small firms are pulling down the average). These are interesting findings from an economics and policy making standpoint, equally useful findings from a management view. The paper finally presents suggestions of what can be done, including how the study and its methods/results can be improved. A summary-style publication in 1983 [45] discusses the productivity in the small business sector between 1965 and 1976. One of the main conclusions is that there are variations each year but the larger firms demonstrate higher productivity than the smaller ones.
This paper [46] from 1986 does an excellent comparison between small and large manufacturing firms on labor productivity, wage rates and capital intensity. Focusing primarily on labor productivity, average productivity of small firms was about 90.9% that of large firms. Another interesting paper [47] in 1987 compares large and small firms on different parameters, productivity being one of them. This study was based on the 1976 US Census Bureau data to cover essentially all manufacturing firms. One of the first observations is that small firms employed 24.7% of the entire workforce but produced only 18.4% of the total output (this points us to how small business productivity is in general). The output per worker is almost a third higher in large manufacturing firms than in smalll ones. But one caveat the authors themselves have mentioned is that the highly productive large firms are from a different industry than the less productive small firms - strictly conducting an industry-level comparison would be a better approach. But if one considers manufacturing as a whole, the above are the results. An interesting paper from 1999 [48] argues how workers are more productive in large firms, and the argument is different from what has been seen so far - it is that “firms that achieve large size create jobs (technologies, equipment and work organizations) that must be matched with more productive indivduals”. Along with the advantages big firms have in terms of being better informed, having favorable credits and the edge of technology and better organization, it is argued that such big firms attract more capable individuals and do a better job of selecting more capable individuals, and therefore benefit from this. From the little number of publications we have seen so far, workers were all considered same/similar in competency/ability/intelligence, but this paper breaks that norm (there is research in both economics and psychology which delve into this subject).
Bank of Canada conducted a comprehensive study to understand the relationship between firm size and productivity [49] on firm data between 1984 and 1997 from Canada and the USA. The goal was not just to understand the relationship but also attempt to explain the productivity gap among industries between Canada and USA - if difference in distribution of firms in Canada and USA could possibly explain it. This is one of the very first papers that considers TFP (Total Factor Productivity) as the productivity metric for the study (and not just labor productivity unlike earlier studies). The following is the summary of the paper (right from its abstract).
A positive relationship between firm size and both labour productivity and TFP is found in both the manufacturing and non-manufacturing sectors. Given this relationship, the difference in the employment distribution over firm sizes between Canada and the United States can account for half of the Canada-U.S. labour productivity gap in manufacturing.
A deep-dive is necessary for this paper because it sheds a lot of interesting insights. First of all, It argues that the relationship between firm size and labor productivity is stronger in manufacturing (something we have seen in earlier publications), whereas its stronger between firm size and TFP in non-manufacturing firms. Talking strictly about labor productivity,
Although the strength of the relationship does áuctuate over time, the overall pattern is clear; small firms are less productive than larger ones.
Add to that,
Over time, large firms also appear to become relative more productive than small firms. This is due to the fact that productivity in large Örms has risen faster than productivity in small firms, and not to shifts in industry structure.15 Furthermore, the increase in steepness of the productivity-employment size relationship is not the result of larger Örms simply becoming larger. As shown later, the average number of employees per firm has decreased in large Örms.
Authors argue that some of the productivity difference between large and small firms could be because of high concentration of small firms in naturally low productivity industries (as argued in [43] as well). Another important factor is industry - although there is a general trend, things are different for each industry. One example is the observation that labor productivity is the higher in small firms in the agriculture industry than general large firms. Another learning about labor productivity is its high correlation with capital intensity (as observed in [46]). The capital to labor ratios are lowest in industries where the relationship between firm size and labor productivity is weakest/highly fluctuating/inconsistent. There is a lot of industry-specific findings which are relevant. Another paper by the same authors present the same findings in a summarized manner here [50].
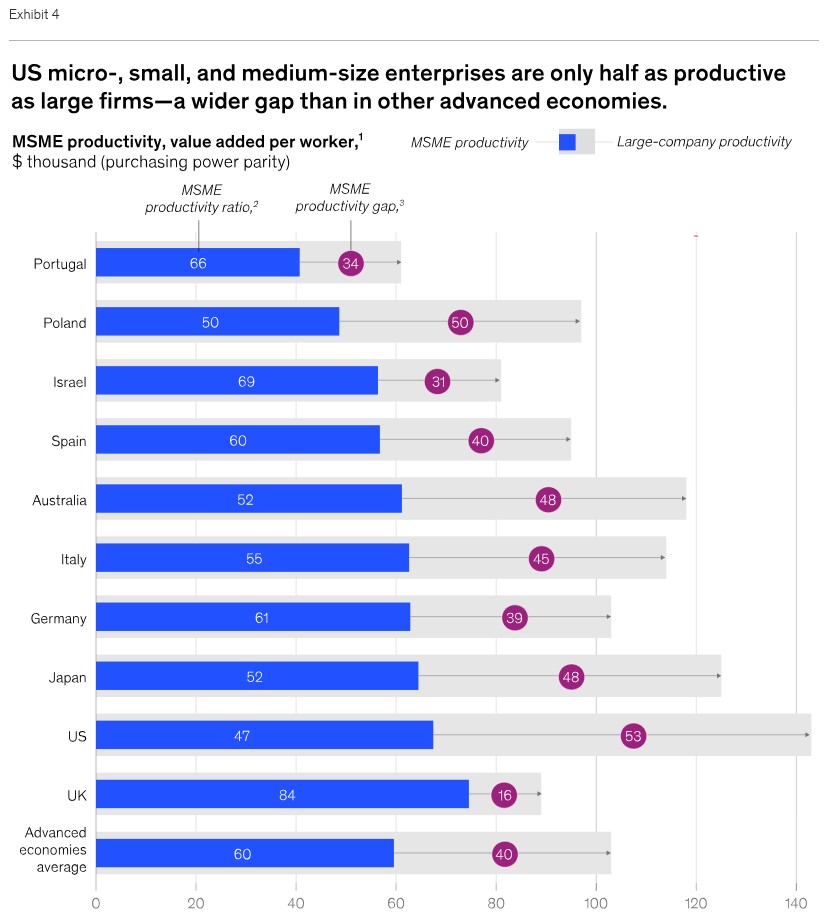
in 2024, the McKinsey Global Institute published detailed reports on our topic of discussion [51, 52, 53]. Despite the stellar contributions of small businesses to the US (an global) economy - like significant employment share, contribution to GDP etc., they seem to struggle with productivity. The report argues that the the MSMEs (Micro, Small and Medium-size Enterprise) in the US are about half as productive as large firms, a gap between small and large firms that is larger than other advanced economies (like European ones). Below is a simple chart regarding the same.
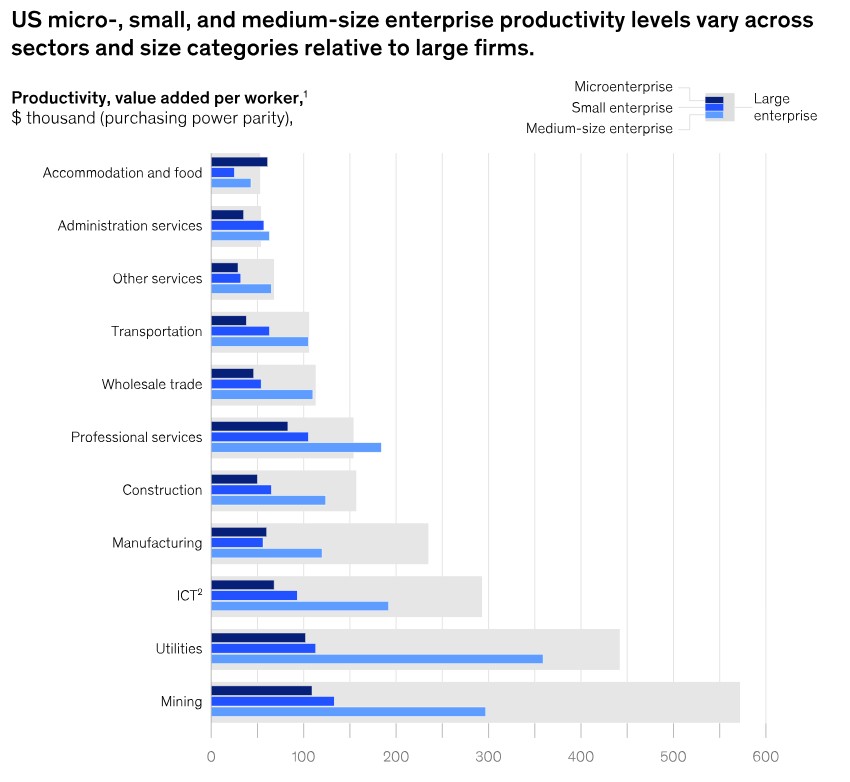
But small business productivity widely vary from industry to industry. Consider the below figure.
Small business productivity also varies based on regions - it is generally observed that they are more productive around some states and metro areas, possibly owing to better regulations, policies and business environment. The report is quite comprehensive and deserves a good read.
7. What next?
Further reading: The objective of this article was to just understand the effect firm size has on productivity, and if there is atleast roughly a consistent relationship between them.Obvious next steps would be look at the causes/reasons for this closely, some of which we saw in the previous section. An industry-level analysis is necessary for the productivity discussion to be more effective. Then see how the low productivity problem can be tackled - either with technology, better management practices, policy and financial aid and so on. This is a good time to share some relevant resources related to this topic of discussion. The goal of the previous section was just to cover a few publications and reports on firm size and productivity in the USA. But the academic literature is filled with similar papers, publications and reports on various nations and industries. As we saw in one of the earlier sections, we are simply observing the covariance between firm size and productivity - literature on this can also be looked at to get better insights. Finally, one can find a quality literature review on Small business productivity research here [54].
Broader takeaway: There is a bigger picture I want you as a reader to takeaway from this article. It is that productivity at firm level has far reaching consequences (than just numbers in the income statement,which are important too, not undermining that). Productivity has an important relationship with firm entry, working with entry barriers, firm survival, firm expansion, firm exit - all of which are strategic in nature. Productivity is obviously a big topic in management, but is a massive subject of research in economics. It has unreal consequences on the economy, and there are stalwards who have dedicated their lives studying it. I think we didn’t even scratch the surface here, but its a start. I think small business owners of a certain industry should have a good picture of these macro-economic indicators (like productivity, firm turnover (how rapidly firms enter and exit a given industry)) of atleast that industry if not the entire economy, I think the broader picture will make them better operators and strategists.
Food for thought: What the debate on productivity in small firms did to me is to look at small businesses in a critical manner. Most of the articles in small businesses tend to have a tone of applause, and carry the “small is beautiful” aura with them. While that is true, I think we have seen they do have some problems. Low productivity, high firm turnover (firms are not as stable as large ones, they exit and enter fast), jobs are created but are also killed (low job stability), dicey wages to name a few. But which is better? For a developing economy like India, is it better to have a large number of small firms, or a small number of large firms, or a movement towards large firms (aka concentration of market, consolidation of firms)? To take a specific example, consider India’s coir industry [55]. This is one industry absolutely dominated by MSMEs. Infact the Indian coir industry dominates the global coir market. Small businesses are the backbone of this industry. But what is stopping from small firms expanding to become large firms in the industry? Are there structural problems which stop from that happening? Is this a highly industrialized/mechanized industry, or one that depends highly on labor? Large number of MSMEs vs. Small number of large firms - which is better? (for workers, industry, economy, which is better to becoming more competitive in the global market?) At some point, we’ll do an industry analysis and see what it is. If you want to go deeper into this debate, you may start with these three - An article on The Economist giving a quick overview on why small is not beautiful [56], a paper that makes a case on why small is not beautiful [57] and a book that looks at it from a different angles [58]. The book has a ranty tone, if you can bear it, its a good read.
Upcoming: Initial plan (it still is) was to write about management of small businesses, but productivity really caught my attention, hence spent some time delving into it. I’ll stick to the initial plan moving forward. Next couple of articles would be pertaining to management of small businesses (which is the broader subject of discussion) - financial management in small firms, expansion-exporting-internationalization, strategic management, small businesses and M&A and so on. But economics, industrial economics in particular has put its charm on me, so will be sharing bits from it now and then.
Real conclusion: With that, we conclude the article. It was a fairly new topic (both productivity and small businesses), so got a good opportunity to read and learn about some interesting stuff. Hope you learnt something as well. I am always up for a discussion related to this, so feel free to leave a comment here or ping me on instagram (@gauthamadwaith). Would be more than happy to have a discussion. Thank you for reading!
Cheers!
Adwaith
8. References
- Size Matters in Economics by Keshav Bedi / Pure Economics
- Keshav Bedi / Pure Economics
- India: 2025 Article IV Consultation-Press Release; Staff Report; and Statement by the Executive Director for India
- Review of The Rise and Fall of the Italian Economy
- The Rise and Fall of the Italian Economy
- Labour Productivity and Utilization
- Material Productivity
- Multifactor Productivity
- GDP per hour worked
- Measuring Productivity - OECD Manual - Measurement of Aggregate and Industry-level Productivity Growth
- Total Factor Productivity - Article by IMF, Robert Zymek
- Measuring Total Factor Productivity at the Firm Level using OECD-ORBIS
- The Economics of Firm Productivity: Concepts, Tools and Evidence - Section 2.3: Production Function and Total Factor Productivity
- Productivity and Prosperity by Gita Bhatt, September 2024
- Sectoral Analysis of Productivity in Developing and Developed Countries of Asia-Pacific
- How Firm-level data improves our understanding of productivity by Sumit Dey-Choudhary, December 2025
- Measuring Total Factor Productivity at the Firm Level using OECD-ORBIS
- Productivity Differences Between and Within Countries, 2010
- On Porductivity and Distortions across Countries
- Productivity and Firm Exit during the COVID-19 crisis: Cross-country evidence, 2022
- Understanding firm exit: A systematic literature review, 2022
- Firms in International Trade, 2007
- The Impact of Trade Intra-Industry Reallocations and Aggregate Industry Productivity, April 2002
- US Bureau of Labor Statistics, Economic News Release, May 7, 2026
- US Bureau of Labor Statistics, Labor Productivity Costs and Measures for Major Sectors Data
- US Bureau of Labor Statistics, Total Factor Productivity - 2025
- Measuring productivity: How it impacts the US economy
- Longitudinal Business Database - LBD, by US Census Bureau
- Business Register, by US Census Bureau
- US Census Bureau
- The OECD ORBIS Database
- India’s Online Microdata Library
- Patterms of Firm-Level Productivity in Ireland, OECD Productivity Working Papers, September 2018
- EU MSME classification criteria
- India MSME classification criteria
- Census Bureau Data Tell the Small Business Story
- US SBA 2022 Small Business Profile
- US SBA FAQ, 2026
- Firm Size and Inventive Activity, 1971
- Firm size and research activity: France and the United States, 1970
- Firm Size and Efficient Entrepreneurial Activity: A reformulation of the Schumpeter Hypothesis
- Upcoming Improvements to the Longitudinal Business Database and the Business Dynamics Statistics
- Profitability Patterns and Firm Size, 1980
- Labor Productivity in Large and Small Enterprises, 1980
- Supervision, Loss of Control and the Optimum Size of the Firm
- Productivity in the Small Business Sector, 1965 - 1976, 1984
- Determinants of the Size of the Small Business Sector: They are Labor Productivity, Wage Rates and Capital Intensity, 1986
- A Comparison of Large and Small Firm Productivity, Labor Compensation, and Investment Rates, 1987: Review of Business and Economic Research (RBER), Volume 23, Issue 1, Link 2
- Workers Are More Productive in Large Firms, 1999
- Firm Size and Productivity, 2008, Bank of Canada
- Producivity in Canada: Does Firm Size Matter?
- Time to think big to close America’s small business productivity gap, McKinsey Global Institute, 2024
- America’s small businesses: Time to think big, McKinsey Global Institute, 2024
- A microscope on small businesses: Spotting opportunities to boost productivity, McKinsey Global Institute, 2024
- Mapping SME productivity research, 2022
- MSMEs - Coir Industry Performance Dashboard, Government of India, FY 2021-22 to FY 2025-26
- Small is not Beautiful
- Small is not beautiful - the case against special regulatory treatment of small firms
- Big is Beautiful: Debunking the Myth of Small Business, 2018, by Robert D. Atkinson and Michael Lind