Analysis of the International Trade Network (ITN) with Community Detection
TLDR: 2026-07-12: This is the foundation/1st part of the article on an interesting paper implementation I am working on. The article will be updated as and when I implement more parts of it. Do go ahead and read the progress so far. Cheers!
Hello,
An interesting subject in the field of economics is international trade. My understanding of this subject is quite informal and have been wanting to look into it in a serious manner. Practically, international trade consists of nations importing and exporting a variety of goods and services to and from another set of nations and this is what makes it one large network, the international trade network (ITN). There are different views to this network: It can be viewed at the level of regions (Americas/Europe/Asia etc.,) to individual nations to even at the firm level. This international trade network that we see is the practical result of all the policies (of different nations), agreements, MoUs and so on between and among so many parties. On the other hand, it is the gateway to the field of international trade (which is one of the core areas of international economics). Adding to that, there are more layers like trade of which commodities or industry is under discussion, are we talking about oil, metals, steel and industrial, military equipment, luxury, electronics and so on. There are so many industries and countless commodities which are involved in international trade. Adding more complexity, international macroeconomics (capital flows, exchange rates, monetary systems) are strongly linked to international trade. With the subject being so vast and with so many moving parts, I think just to get a good view of ITN, how it looks like in 2026 and looking at some of its interesting aspects in a legible and consistent manner would be a good start.
While searching for publications that can be good starting points for this endevour, I came across a host of publications that views the ITN as one large complex graph/network and using it to conduct certain analysis on them. In that one class of publications dealth with identifying different unique groups of importance (or formally known as communities) within the ITN [10]. For example, if we consider the international trade network of the textile industry where at the granularity of nations, China, India, Bangladesh and Vietnam would be the 4 nodes of importance because they lead in textile production and China-India-Bangladesh-Vietnam can be seen as a community from Asia which have trade flows (or linkages) with a large number of nations. Similarly, France and Italy individually are leaders in the classic luxury industry, and them along with a few other european nations which lead in more nuanced luxury would form a community based in Europe. OPEC countries form a community for Oil production, US probably single-handedly forms a one-node community for military equipment production and export. At a macro-level, it would be very interesting to see which nodes and communities are formed (from both production and consumption point of view) for different industries and commodities (or at a aggregate level), we would get a sense of who is exporting a lot, who is big on imports and so on, or to answer hot questions like “how has the world changed post globalization” or “is the world more globalized or regionalized today” and so on.
Turns out community identification in ITN is somewhat of a niche research field in itself where researchers and economists and spent good part of their lives improving the methods to do it and to gain better insights post analysis. One interesting publication I came across in this genre is “The Rise of China in the ITN” [11] from 2014, which discusses the rise of China in the ITN over the last few decades. China’s rise as a trade superpower has been a hot topic of discussion atleast in the last decade if not more, so it will be interesting to take a closer look at it. The paper is fairly simple, it is understandable, and most importantly, the datasets and methods used for analysis are all available for public use. And the analysis can be extended (and I am sure it has already been extended) in many directions once we get a hold of it.
This article is all about reading, understanding and actually implementing this publication, the lowest goal I would like to keep is to just reproduce the results if not expanding on the work done, and documenting the learnings along the way.
1. What is the paper about?
The paper [11] is named “The Rise of China in the ITN: A Community Core Detection Approach”, published in 2014 by a couple of physicists and mathematicians from Europe. At a high level, the paper attempts to look at the evolution of the ITN, observe the changes it has undergone and find possible reasons behind the changes. The ITN can undergo several types of changes: Certain nations grow up to become large exporting nations over years, some who were leaders earlier fall behind due to different reasons, the dynamics involved in such changes. To be specific, there are two phenomena that are observed: There are broadly 3 communities: Americas, Europe and Asia-Oceania communities (each with a number of nations inside it). It is observed by the authors that the Asia-Oceania community disappeared for a brief period and reemerged, along the same time when Japan was the leader in Asia-Oceania community and the leadership got shifted to China. One is a global phenomenon (Disappearance and reemergence of entire Asia-Oceania community) and a regional phenomenon (change in leadership from Japan to China). The paper has different ways to analyze these phenomenon and see if they can explain them, if there is any correlation between the global and regional phenomena. Below is the entire abstract of the paper to in case you are want the exact details.
Theory of complex networks proved successful in the description of a variety of static networks ranging from biology to computer and social sciences and to economics and finance. Here we use network models to describe the evolution of a particular economic system, namely the International Trade Network (ITN). Previous studies often assume that globalization and regionalization in international trade are contradictory to each other. We re-examine the relationship between globalization and regionalization by viewing the international trade system as an interdependent complex network. We use the modularity optimization method to detect communities and community cores in the ITN during the years 1995-2011. We find rich dynamics over time both inter- and intra-communities. Most importantly, we have a multilevel description of the evolution where the global dynamics (i.e., communities disappear or reemerge) tend to be correlated with the regional dynamics (i.e., community core changes between community members). In particular, the Asia-Oceania community disappeared and reemerged over time along with a switch in leadership from Japan to China. Moreover, simulation results show that the global dynamics can be generated by a preferential attachment mechanism both inter- and intra-communities.
The ideal next step here would be to talk about each of these parts in a little bit more detail so that we can plan the implementation better. But one of the pre-requisites to the next step is to have an understanding of the concept of community detection, which is at the heart of this paper. So we will take a small deroute, get a quick gist of community detection and then go back to our paper.
2. What is Community Detection?
We observe large graphs everywhere today. One can find graphs and networks in literally every field we see. One of the most intuitive type of graphs are the social graphs [1], typically formed by big social media platforms, where people (or their accounts) are the nodes and the connections/follows are the edges. Knowledge Graphs [2] is one which has lots of knowledge sources linked together (possibly with authors and users) in a meaningful manner. Search companies like Google and Microsoft have their own knowledge graphs, DBpedia [3] is a knowledge graph built out of Wikipedia. The academic world also has knowledge graphs. One obvious example is where academic publications are the nodes and the citations can be seen as linkages (each of the large academic publishing companies would definitely have such knowledge graphs). There are highly complex network structures found in Biology [4], one example is cells as nodes and the variety of interactions they have with other cells as linkages. On the business side, logistics companies will typically be working with large logistics/transportation graphs. In economics, we have trade networks where goods and services flows to and fro out of different regions (cities, states, nations etc.,).
One interesting and obvious characteristic about real world graphs are that all the nodes are different. Certain nodes tend to have higher importance, with the meaning of “importance” being very context-specific to the graph at discussion. When it comes to social graphs, nodes with very high influence (typically measured by the number of followers) like actors, sportsmen, big influeners etc., There could be websites and documents that have been most accessed by via Google, there could be very highly cited publications which have had high real world consequences. When it comes to international trade in the textiles industry, China leads the production with India, Bangladesh and Vietnam following it - these are important nodes in the textile trade, another example would be how France or Italy are very high importance nodes in the luxury industry.
Going one step further, it is not just individual nodes that have higher importance. We can have a bunch of nodes which are often linked to each other who all have higher importance: These are groups of linked nodes that are of higher importance. Taking the example of textile trade, China-India-Bangladesh-Vietnam are asian countries who lead in textile production, making them group of importance nodes in the international textile trade. Same with bunch of european nations leading in luxury industry (they are all important nodes in their respective industries and linked through their geography). Or it could be the ground-breaking publications from members of a particular research team in the academic knowledge graph. Such groups of nodes are defined as communities in the formal world. A typical community has high concentration of linkages whereas linkage between communities will be sparse (less in number). Checkout the sample network below. This network has 4 communities. The nodes inside each community are strongly to other nodes in the same community, but the communities themselves are weakly linked.
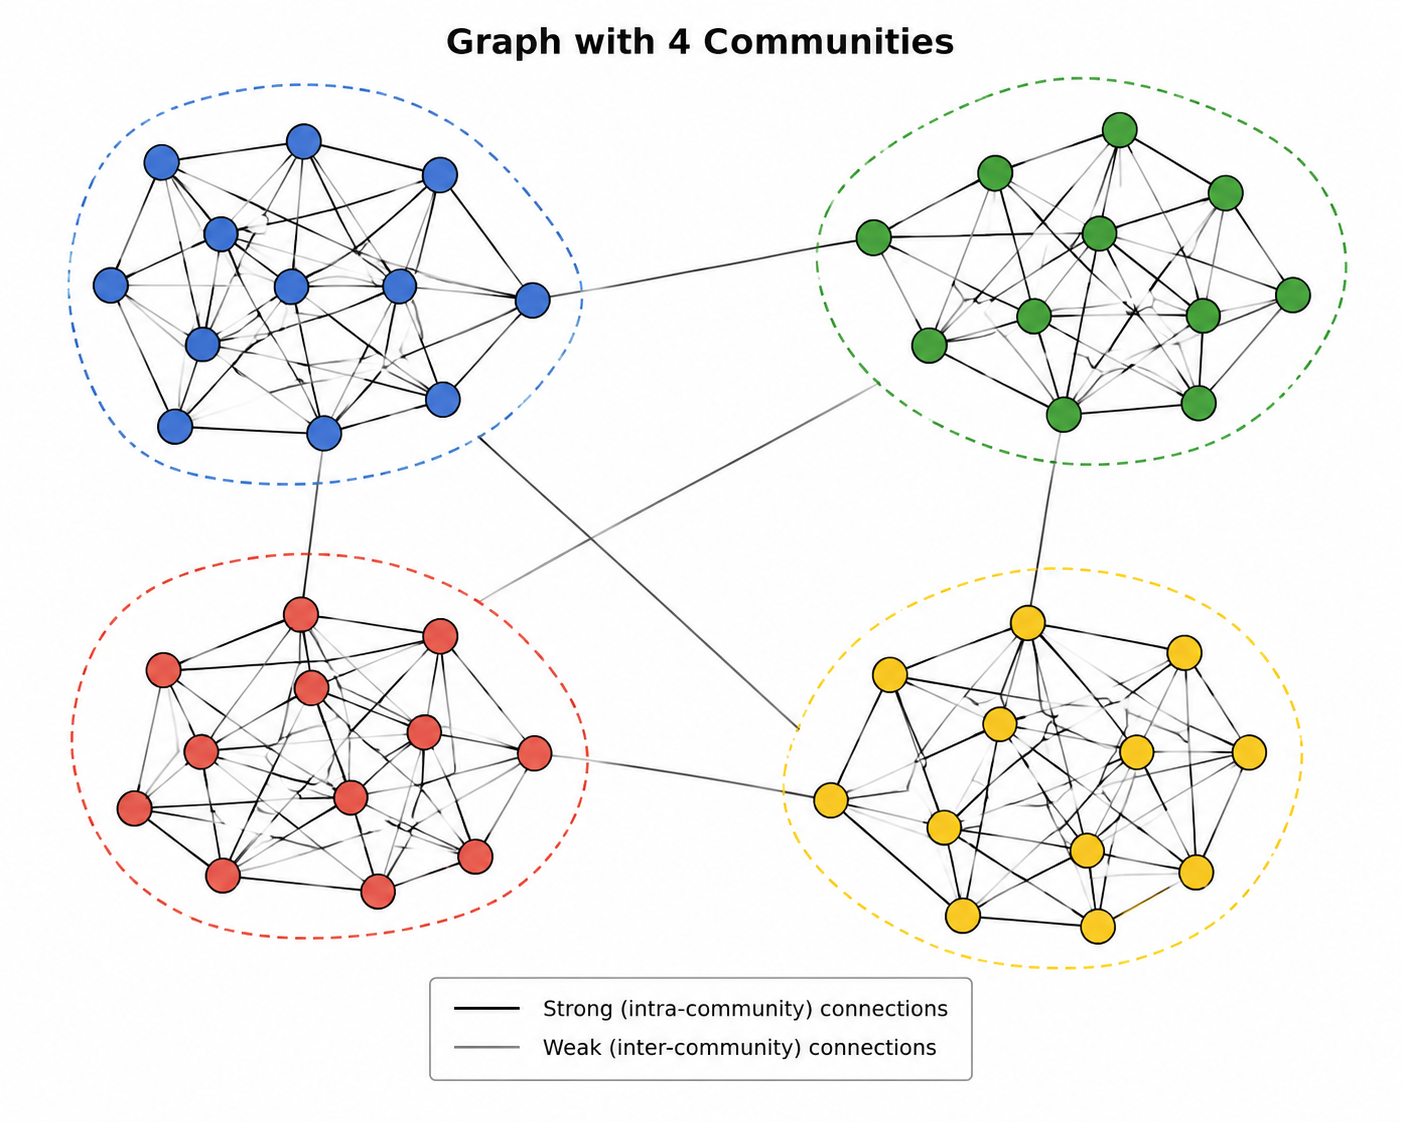
While understanding the idea of communities in graphs is quite intuitive, algorithmically identifying all such communities given a large graph is not a trivial problem. This problem is formally known as graph partitioning [13] in computer science. We partition the graph (or break the graph into different pieces) based on a certain condition. This problem is known to be an NP-Hard problem (aka mostly no polynomial-time algorithms exist. As the number of nodes increases, the complexity increases in an exponential manner). There is a greal deal of research that has happened over the last couple of decades on this particular problem [5]. There are vastly different approaches to identify communities inside a graph [5], we would be sticking to one class of optimization algorithms that tackle this problem. Some of the landmark methods in this space are Girvan-Newman [8], the introduction of modularity as the objective function for optimization [9] which is used now in different shapes and forms today as well, the Louvain algorithm [6] in 2008 and the recent Leiden algorithm [7] which identified problems with Louvain and suggested an improved method. To reiterate, these algorithms are known as modularity optimization algorithms. Plan is to deep dive into one of these methods which we will be using as part of paper implementation.
3. Broad Goals
Now that we have a primer on international trade network and community detection, we can move forward. After reading the paper, I think this is how we should go about implementing it. There are 4 stages in which it will be implemented.
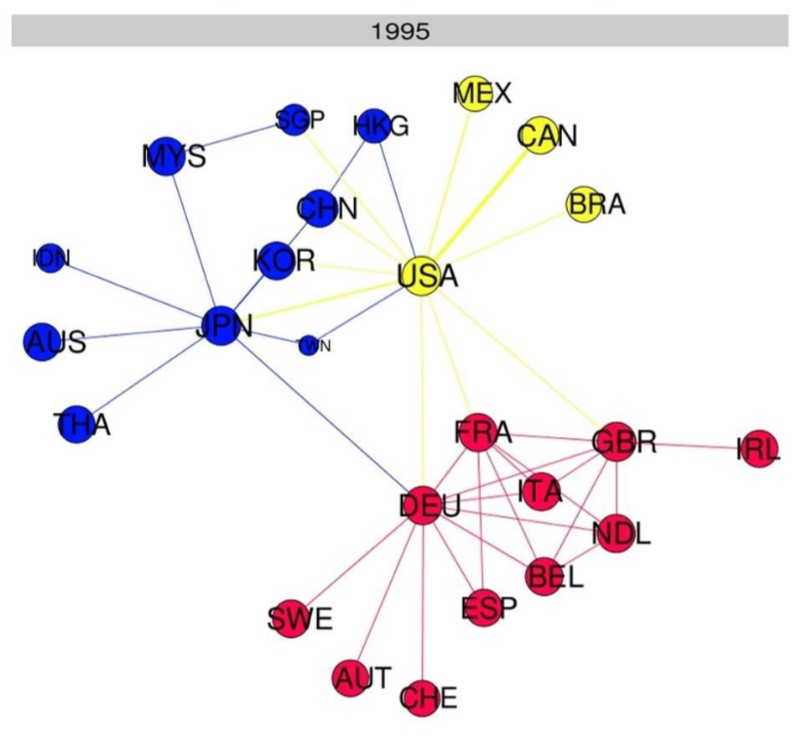
- Constructing ITN from Datasets: This is the foundational step, where we take a closer look at the dataset, give it a good descriptive analysis and understand it better. Then we look at the community detection method we want to implement and do a deep dive. Once that is done, we apply the community detection algorithm on the dataset to get the ITN for a particular time instance (say for the year 2023-24). We should have a rich descriptive analysis and visualization on the ITN of a particular time instance. The below diagram is ITN as of 1995 generated from the dataset.
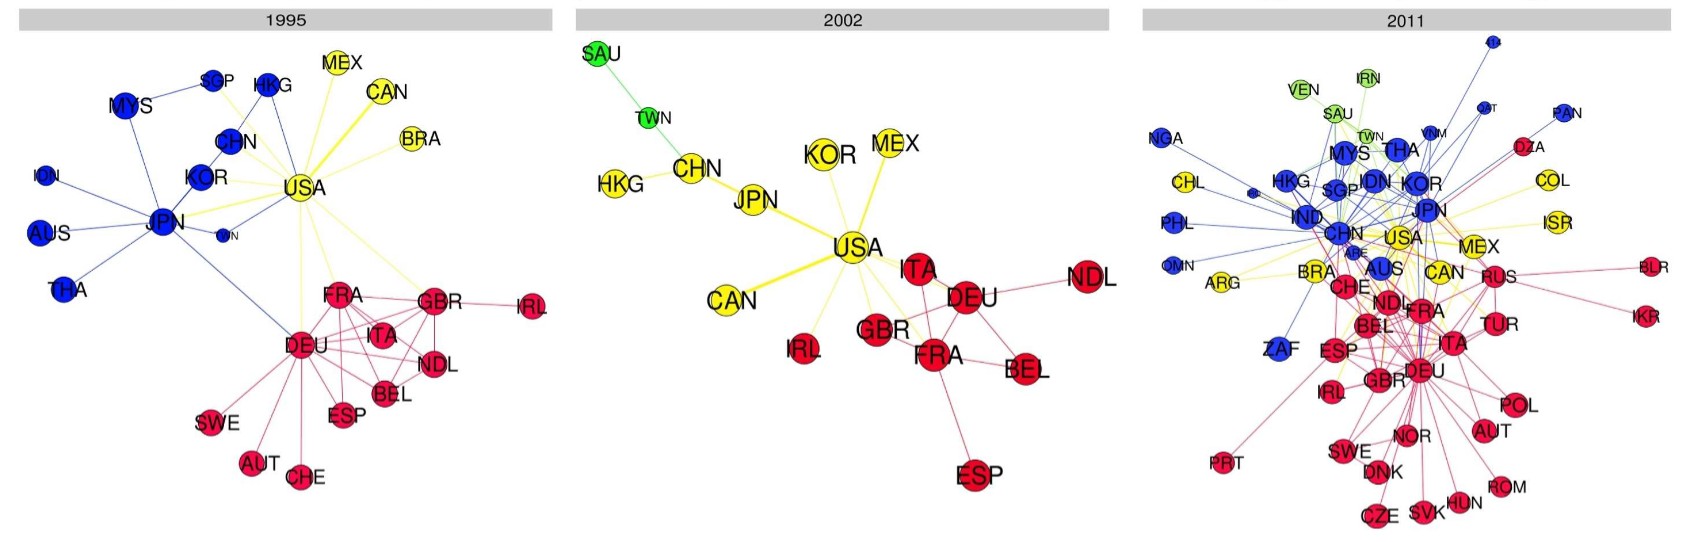
- Evolution of ITNs over time: The next incremental step would be to apply the community detection algorithm on datasets from different years and be able to observe the evolution of ITN over the years. The descriptive analysis and visualizatins for each ITN will come in handy in comparing how ITN has changed with time. Here in we should be able to observe the global phenomenon of disappearance and reemergence of the Asia-Oceania community from the global ITN, and ideally be able to reproduce all the other relevant observations in the paper. The below diagram should give a sense of ITN evolution over decades - Japan being the leader of the Asia-Oceania community in 1995, to the Asia-Oceania community disappearing and getting merged into the Americas community by 2002 to Asia-Oceania community reemerging with China in a dominant position.
-
Community Core Detection: A community is made up of a number of nodes, and even here each node would be different. The paper describes how the Asia-Oceania community was once led by Japan (between 1995-2001) and in a couple of years, China emerged as the leader. Japan was a more important node during a certain time period and China became a more important node at a later time period. The paper describes the idea of community core, a part of the community which is more important to that community (first Japan was more important, then China at a later point in time). In this stage, we implement the community core detection described in the paper so that we are able to observe the regional phenomenon of change in leadership. In the previous diagram, in the year 1995, it can be observed that JPN (Japan) was the core of the Asia-Oceania community (Blue), USA for the Americas and Deutchland (DEU/Germany), France (FRA) and United Kingdom (GBR/Great Britain) as the cores. Notice how China (CHN) has just 3 linkages (to HKG/Hong Kong, KOR/Korea, and USA) whereas Japan has many linkages (this shows the extend of trade with other nations). Fast forward 2011, China has equal or maybe more linkages than Japan has (it probably is more based on the inferences made in the paper), depicting China emerging as the leader in Asia-Oceania community.
-
Linkage between global and regional dynamics: Finally, the paper describes a model to explain the possible linkage/correlation between the global and regional phenomena along with empirical evidence. We will do a deep dive on this as well.
These four steps should broadly cover all aspects of the paper. In the process, we ensure to reproduce all the figures and diagrams in the paper, along with possibly independent observations.
4. Future Work and Conclusion
This post was the foundational article of the paper implementation. The actual implementation, analysis and discussion will be updated in parts in the same article in due time. Thank you for reading.
Cheers!
Adwaith
References
- The Rise of Social Graphs for Businesses - HBR
- Knowledge Graphs on the Web: An Overview
- DBpedia: A Nucleus for a Web of Open Data - 2007
- Networks in Cell Biology - Mark Buchanan, 2010
- Community Structure in Graphs: 2007
- Fast unfolding of communities in large networks - the Louvain algorithm, 2008
- From Louvain to Leiden: Guaranteeing well-connected communities, 2018
- Finding and evaluating community structure in networks: Girvan & Newman algorithm, 2002
- Modularity and community structure in networks: Newman, 2006
- Identifying the Community Structure of the International-Trade Multi Network, 2011
- The Rise of China in the International Trade Network: A Community Core Detection Approach, 2014
- Asia-Oceania, by Ministry of Foreign Affairs, Japan
- Graph Partitioning, Wikipedia